DevOps
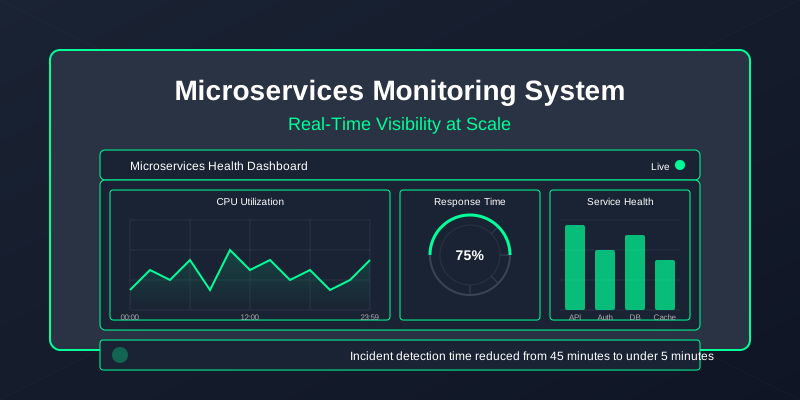
Microservices Monitoring System: Real-Time Visibility at Scale

Your Name
2025-02-18 · 7 min read
Learn how a comprehensive monitoring solution with anomaly detection improved incident response time by 75% for a distributed system.
The Challenge
A SaaS company with a growing microservices architecture was facing critical monitoring challenges:The Solution
I designed and implemented a comprehensive monitoring solution that provided end-to-end visibility: #1. Metrics Collection and Storage
Deployed Prometheus for metrics collection with custom exporters for application-specific metrics and service-level objectives (SLOs). #2. Visualization and Dashboards
Created Grafana dashboards providing real-time visibility into system health, performance metrics, and business KPIs. #3. Distributed Tracing
Implemented OpenTelemetry for distributed tracing, allowing teams to track requests across service boundaries and identify bottlenecks. #4. Log Aggregation and Analysis
Set up centralized logging with the ELK Stack (Elasticsearch, Logstash, Kibana) with structured logging patterns. #5. Alerting and Notification System
Configured Alertmanager with intelligent routing, grouping, and severity-based escalation paths. #6. Anomaly Detection
Implemented machine learning-based anomaly detection to identify unusual patterns before they became problems.The Results
After implementing the monitoring solution:Key Technologies Used
My Approach to Observability
When building monitoring solutions, I follow these principles: 1. **The Three Pillars**: Integrate metrics, logs, and traces for complete visibility. 2. **Actionable Alerts**: Every alert should be actionable and contain context for resolution. 3. **Service Level Objectives**: Monitor what matters to your users and business. 4. **Cardinality Management**: Balance data granularity with storage and query performance. 5. **Continuous Improvement**: Regularly review and refine monitoring based on incidents.Contact Me for Monitoring Implementation
If your organization is struggling with visibility into complex systems, slow incident response, or looking to implement proactive monitoring, I can help design and implement a comprehensive observability solution tailored to your architecture.Case Study Details
Industry
SaaS
Company Size
Medium (100-200 employees)
Project Duration
2.5 months
Key Challenges
- Limited visibility into system health
- Slow detection of service issues (45+ minutes)
- Difficulty tracing requests across services
- Alert fatigue from false positives
- Reactive rather than proactive troubleshooting
Outcomes
- Reduced incident detection to under 5 minutes
- Improved MTTR by 75%
- Reduced false positive alerts by 85%
- Improved system uptime to 99.99%
- Enabled proactive issue detection
Technologies Used
PrometheusGrafanaELK StackAlertmanagerOpenTelemetry
Need Similar Solutions for Your Business?
I specialize in creating custom devops solutions tailored to your specific requirements. Let's discuss how I can help transform your infrastructure and optimize your operations.
Schedule a Consultation